
Promotional products are easy to order. But hard to understand.
CO₂ data for promotional products – structured instead of scattered
Does this sound familiar?
Many products. Many suppliers. Little overview.
Pens, mugs, textiles, give-aways. Different materials, different origins, different levels of data.
And then come the requirements: CO₂ values in quotes, documentation for clients, questions about origin and production. The problem is rarely willingness. It’s structure. The data exists – somewhere. With the supplier. In a datasheet. In someone’s head.
But not where you need it. What’s missing is not knowledge – but a system. CO₂ data for promotional products doesn’t come from one place. It emerges along the supply chain.
And that’s exactly where ecozoom comes in.
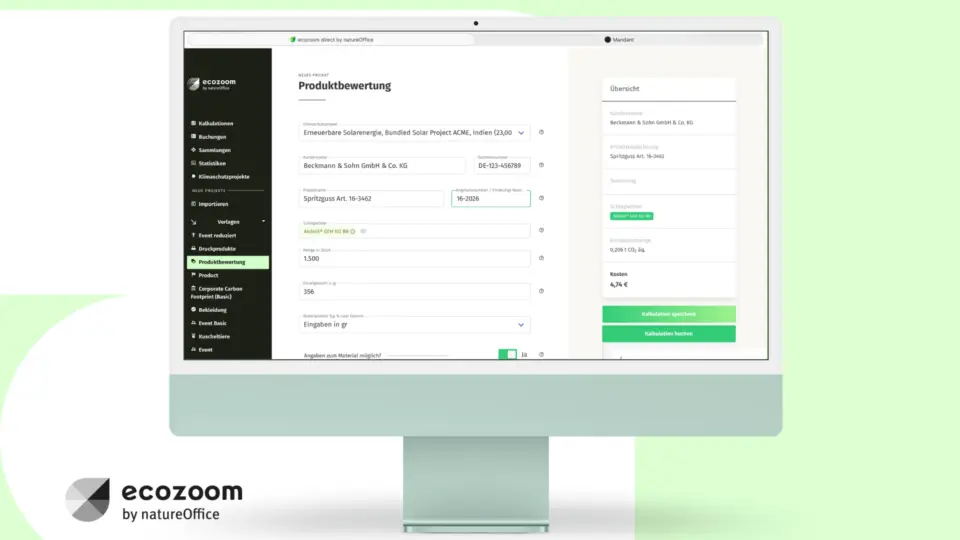
CO₂ belongs on every product datasheet
PCFs don’t have to be complex. If the software is right.
CO₂ data is created along your supply chain.
With ecozoom, it becomes usable.
You calculate traceable CO₂ values for your promotional products –
based on materials, origin, and transport routes.
And in a way that actually works: Per product. Across your entire portfolio. Directly in quotes or conversations.
No detours.
No repeated data collection.
From scattered information to a system
Capturing CO₂ data is one thing. Having it available at the right moment is another. With ecozoom, you calculate traceable CO₂ values for your promotional products – based on your product data.
What actually changes CO₂ values are no longer:
Searched. Estimated. Pieced together.
Instead, they are structured, instantly available, and clearly built – for every single promotional product. Materials, origin, and transport routes are properly accounted for, even when supplier data or datasheets are incomplete.
Step by step, this creates a reliable data foundation across your entire portfolio – from simple give-aways to more complex product sets.
Results can be compared, reused, and applied exactly where they are needed: in quotes, customer conversations, or documentation.
What changes in your operations
You no longer need to explain CO₂. You simply show it.

Give answers – without recalculating
Customers ask for CO₂ values. The answer is already there. Not assumed – but backed by data.

Lower risk in communication
No unclear claims. No uncertainty when questions arise. Just a solid foundation that holds.

Maintain an overview – even across many products
CO₂ data is no longer scattered. It is structured and accessible. You see what is comparable – and where the differences lie.

No need to rebuild every product from scratch
Set it up once – and reuse it. Data connects across products – instead of being recreated each time.
What ecozoom actually covers
All relevant steps around CO₂ data are brought together in one system – from calculation to sharing.
- 1
Carbon footprint per promotional product
Each product receives a traceable carbon footprint – based on materials, production locations, and transport across the entire supply chain.
- 2
Comparison of product variants
Differences become visible – for example in material choice, origin, or production conditions, from simple give-aways to complex product sets.
- 3
Structure for your entire portfolio
Even large and diverse product portfolios are structured – from individual items to extensive assortments with multiple suppliers.
- 4
Directly usable results
CO₂ values are ready to use in quotes, product datasheets, tenders, or customer discussions – without additional preparation.
- 5
Central data base
Product data, supplier information, and emissions are brought together in one place – instead of being scattered across files, spreadsheets, or contacts.
- 6
Reusable logic
Once defined, product structures can be applied to similar items – such as variants, series, or recurring product lines.
- 7
Team collaboration
Everyone works with the same data – from procurement to sales to customer communication, without version conflicts or coordination effort.
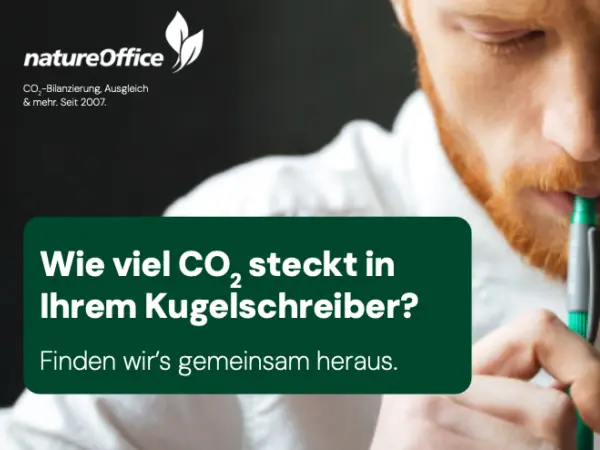
How much CO₂ is in your pen?
The real question is: How often do you want to answer that question from scratch? With ecozoom, not anymore. Set it up once – and scale it.
Download industry overview (German)
Compact and clear: calculate, use, and communicate CO₂ values for promotional products.
Expert opinion DIE6 (German)
Read an article in the magazine of the professional network for promotional products companies.
What happens to the emissions?
Carbon offsetting is not a label – it’s a tool
Offsetting does not undo climate impact. But it shows
how remaining emissions are handled.
And that’s the point:
→ Offsetting is not a label, but a way to deal with residual emissions
→ It does not replace reduction, but also does not conflict with EU regulations
→ It makes emissions visible – instead of ignoring them

The natureOffice label
Three versions of the natureOffice label are available for different applications. Which version is used depends on the respective medium.
How the label works
From the label to the digital record – this is how the associated information becomes visible.
- 1
Label
The natureOffice label is used on products, websites or in company information. It indicates that a documented entry for this product or company exists within the network.
- 2
QR Code / Network ID
Each label contains a QR code and a unique Network ID. Both lead to the digital record where the associated information is stored.
- 3
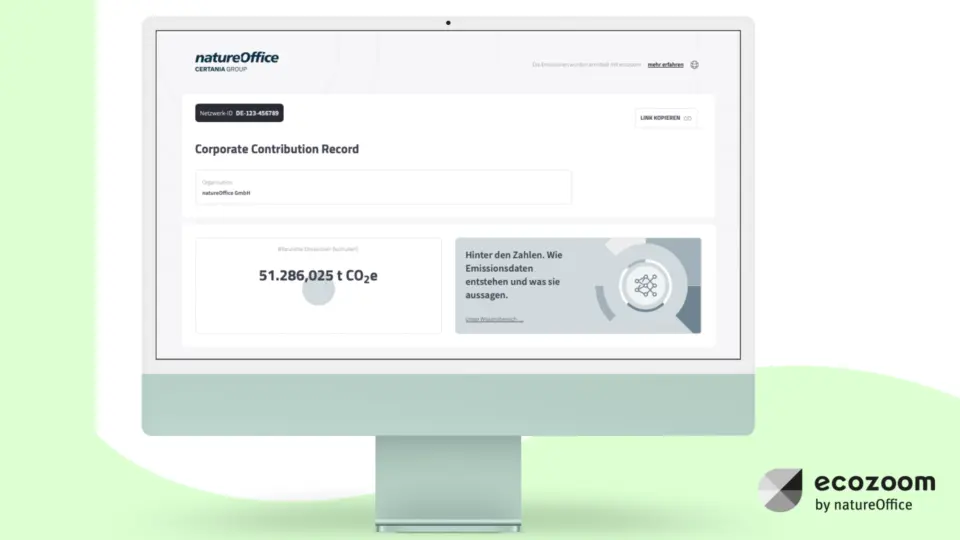
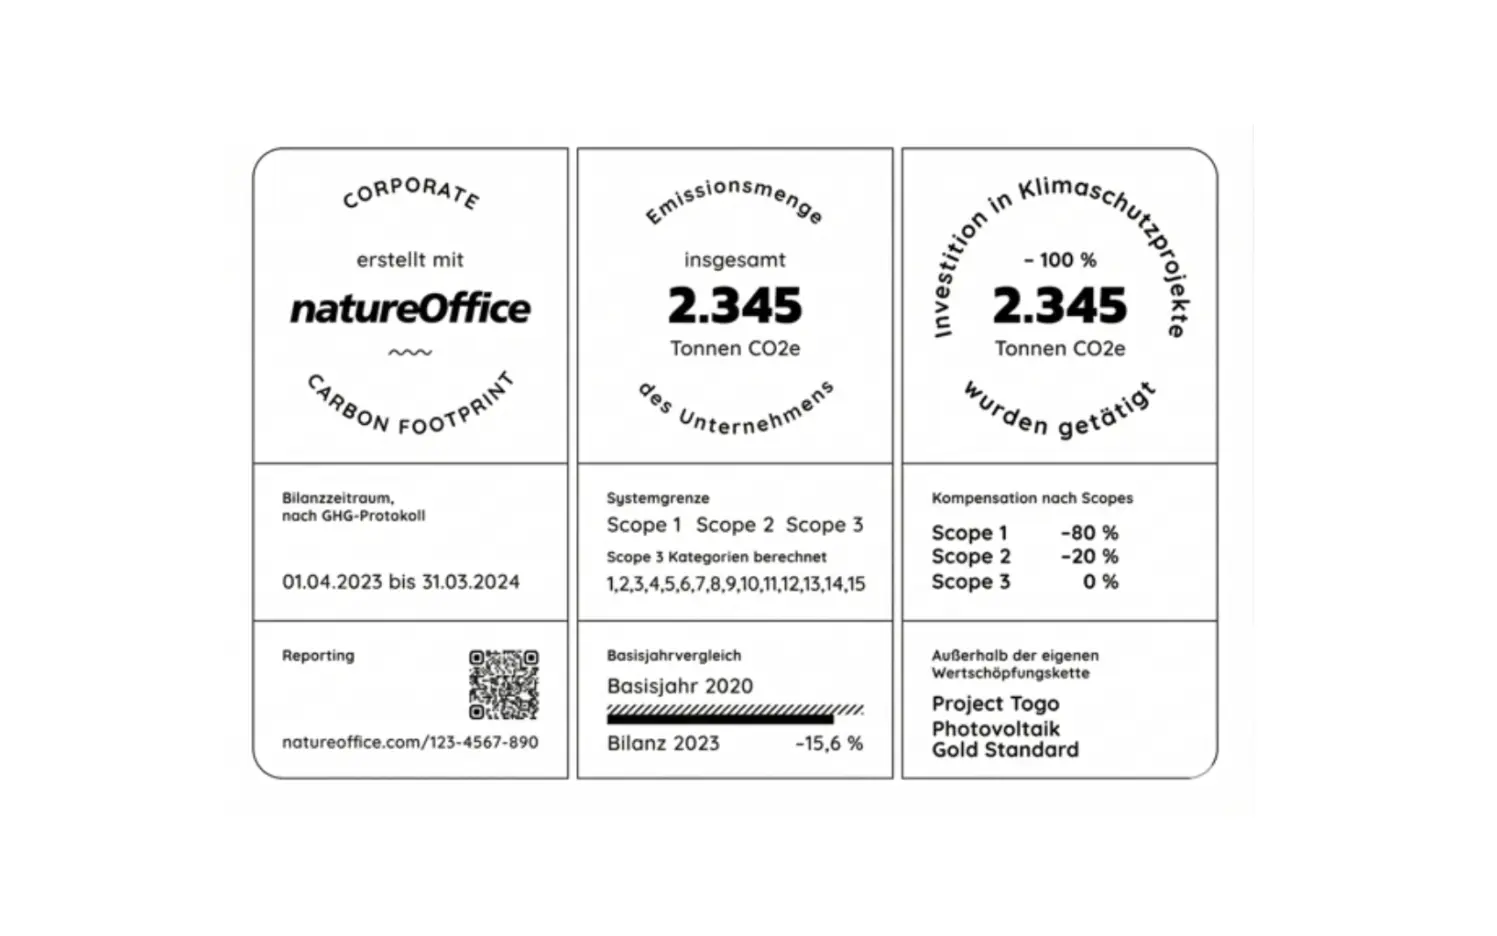
Corporate Contribution Record
By scanning the QR code, users are taken directly to the Corporate Contribution Record. This record serves as the central access point for the documented information of a company.
- 4
Documented Information
Within the Corporate Contribution Record, the provided information is presented in a structured format. This may include, for example, emission data or information on project-related investments.
CO₂ software for promotional products: calculate PCF, use data, meet requirements
Companies working with promotional products increasingly need to capture CO₂ data in a structured way and make it usable in daily operations. Whether for quotes, tenders, or customer discussions – reliable carbon footprint data per product is becoming standard.
Specialized CO₂ software enables the systematic calculation of the Product Carbon Footprint (PCF) – based on materials, production locations, supply chains, and transport. Data is centrally managed, clearly structured, and ready to use.
In the promotional products industry, large portfolios, multiple suppliers, and varying data quality make this particularly challenging. CO₂ software helps structure this complexity and creates comparable results across products.
Alongside PCF, the Corporate Carbon Footprint (CCF) is becoming increasingly relevant – for example in the context of CSRD or supply chain requirements. Both approaches follow standards such as the GHG Protocol and ISO 14067.
Modern solutions replace isolated Excel-based approaches, reduce manual effort, and ensure consistent, verifiable, and usable CO₂ data.